Chaikin Money Flow
This indicator shows you when institutional money is flowing into or out of a stock — directly on the price chart, without switching to a separate panel. Based on the classic Chaikin Money Flow formula, it tracks the relationship between price closes and volume to identify buying and selling pressure.
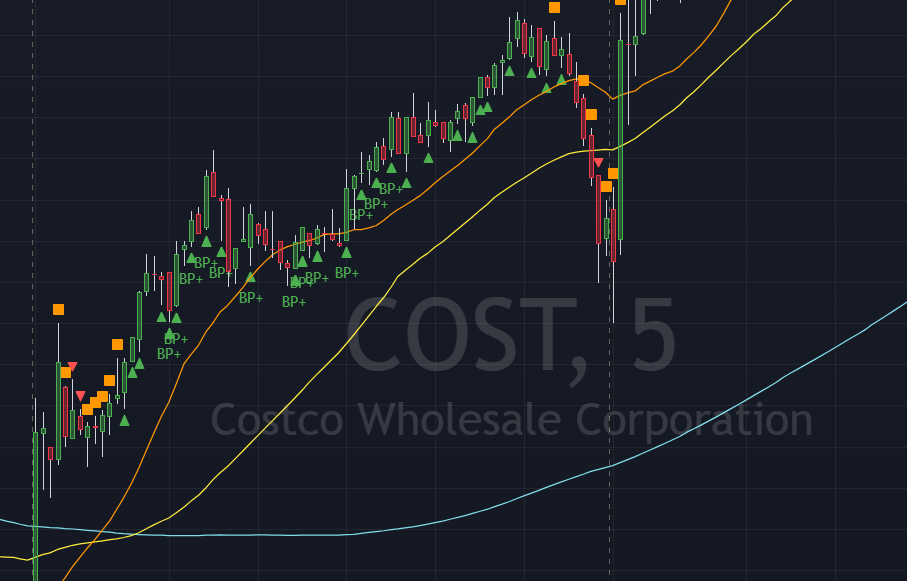
Green triangles appear below bars when money is flowing in (bullish pressure). Red triangles appear above bars when money is flowing out (bearish pressure). The BP+ and SP+ labels mark stronger conviction moves where CMF exceeds ±0.20 — a significant threshold indicating sustained institutional activity. Orange squares flag neutral / indecision zones where money flow is near zero.
Important: This indicator measures money flow strength, not price direction on its own. Use it alongside price action and trend tools to confirm setups.
Signal Guide
| Signal | Shape | CMF Condition | Meaning |
|---|---|---|---|
| Orange Square | Square above bar | |CMF| < 0.05 (near zero) | Indecision — money flow is neutral, watch for breakout |
| Green Triangle (BP) | Triangle below bar | CMF > 0.05 and rising | Buying pressure active — money flowing in |
| Red Triangle (SP) | Triangle above bar | CMF < −0.05 and falling | Selling pressure active — money flowing out |
| Green Triangle (BP+) | Triangle below bar + label | CMF > 0.20 and rising | Strong buying pressure — significant institutional inflow |
| Red Triangle (SP+) | Triangle above bar + label | CMF < −0.20 and falling | Strong selling pressure — significant institutional outflow |
Pine Script Code
//@version=5
indicator("Madstocks-Chaikin Oscillator", overlay=true)
// ──────────────────────────────────────────
// length = input.int(20, minval=1)
// ad = close==high and close==low ? 0 :
//     ((2*close-low-high)/(high-low))*volume
// mf = math.sum(ad, length) /
//       math.sum(volume, length)
// var chaikinMoneyFlowHighB = false
// plotshape(chaikinMoneyFlowHighB,
//     location=location.belowbar, ...)