High Low Pivots
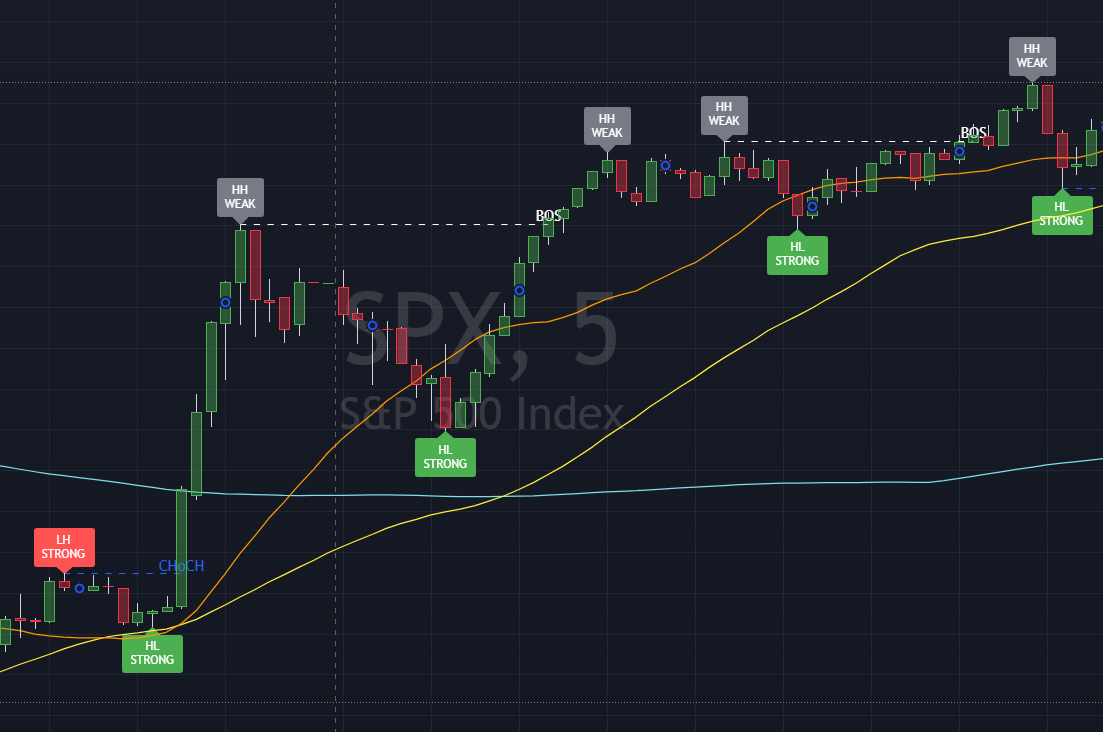
This indicator maps market structure directly on your chart by labeling every swing high and low as HH (Higher High), LH (Lower High), HL (Higher Low), or LL (Lower Low). Each label is further classified as STRONG or WEAK based on whether it confirms or works against the current trend.
When price breaks through a prior swing level, the indicator draws a dashed line and labels it BOS (Break of Structure — trend continuation) or CHoCH (Change of Character — potential trend reversal). Blue lines mark CHoCH events; white lines mark BOS.
Default lookback: 5 bars to each side for pivot detection. Increase for smoother structure on higher timeframes; decrease for more signals on lower timeframes.
Label & Line Reference
| Label / Line | Color | Condition | Meaning |
|---|---|---|---|
| HH — WEAK | Gray | Swing high > prior swing high (bull trend) | Higher High confirming the uptrend — structure intact |
| LH — STRONG | Red | Swing high < prior swing high (bear trend) | Lower High in a downtrend — strong bearish continuation |
| LL — WEAK | Gray | Swing low < prior swing low (bear trend) | Lower Low confirming the downtrend — structure intact |
| HL — STRONG | Green | Swing low > prior swing low (bull trend) | Higher Low in an uptrend — strong bullish continuation |
| BOS | White dashed line | Close crosses prior swing level (same trend) | Break of Structure — trend continues in same direction |
| CHoCH | Blue dashed line | Close crosses prior swing level (opposite trend) | Change of Character — potential trend reversal forming |
Pine Script Code
//@version=5
indicator("Madstocks-High Low Pivots", overlay=true)
// ──────────────────────────────────────────
// lb = input.int(5, "Pivot Lookback")
// ph = ta.pivothigh(high, lb, lb)
// pl = ta.pivotlow(low, lb, lb)
// if not na(ph)
//     label.new(bar_index-lb, ph,
//         structural_type + "\n" + strength ...)
// if ta.crossover(close, last_ph)
//     line.new(...) // BOS or CHoCH