ORB Pro
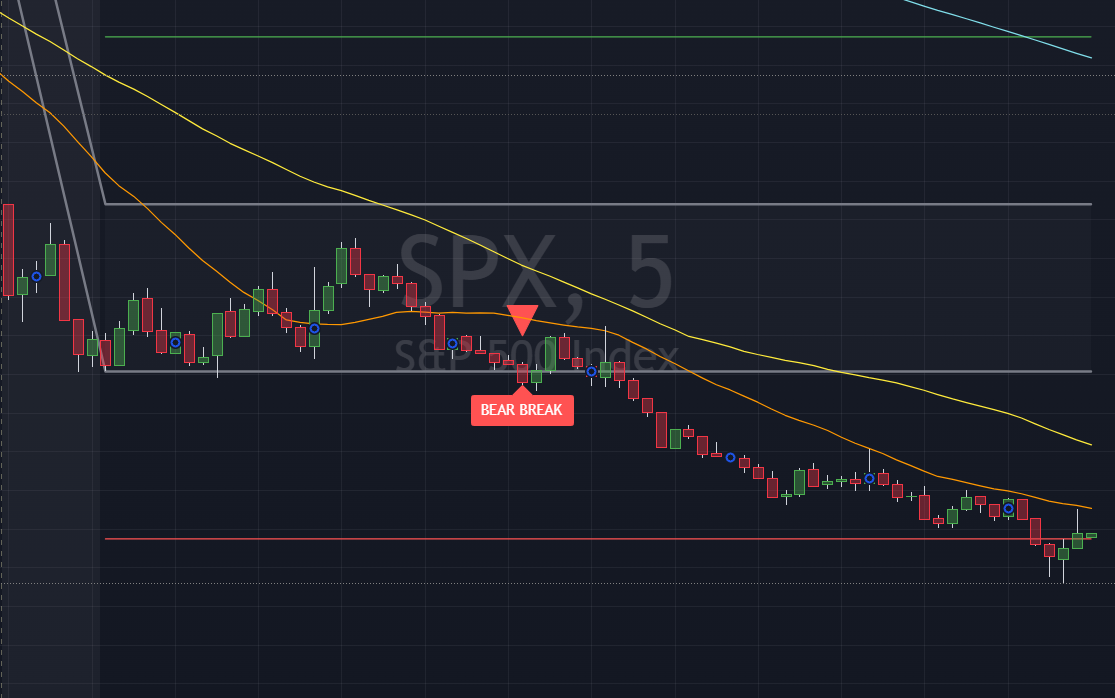
Automatically maps the Opening Range for the first N minutes of the trading session (default 30 min). Once the range is locked, it plots the OR High and OR Low as persistent lines, draws 1:1 extension targets above and below, and fires triangle signals the moment price breaks out.
A subtle background shade highlights the opening range window so you always know exactly when price is still building the range versus when it has escaped. Labels mark each breakout bar so you never miss a move on a busy chart.
Important: ORB setups work best on intraday timeframes (1–15 min) for liquid, high-volume names. Always confirm with broader market context before acting on a breakout signal.
What Gets Plotted
| Element | Description | Default Color |
|---|---|---|
| OR High / OR Low | Persistent horizontal lines at the top and bottom of the opening range | Gray |
| Target High | 1× range extension above OR High — first bullish profit target | Green |
| Target Low | 1× range extension below OR Low — first bearish profit target | Red |
| Background shade | Highlights bars while price is still inside the opening range window | Gray (90% transparent) |
| ▲ Bull Break | Triangle up below bar on the first close above OR High | Green |
| ▼ Bear Break | Triangle down above bar on the first close below OR Low | Red |
| Labels | "BULL BREAK" / "BEAR BREAK" text label on breakout bar (toggleable) | Matches break color |
Pine Script Source
//@version=5
indicator("Madstocks-ORB Pro", overlay=true)

// Input parameters
orb_minutes = input.int(30, title="Opening Range Minutes", minval=5, maxval=120)
show_labels = input.bool(true, title="Show Breakout Labels")
show_targets = input.bool(true, title="Show Target Lines")
alert_enabled = input.bool(true, title="Enable Alerts")

// Colors
bull_color = input.color(color.green, title="Bullish Break Color")
bear_color = input.color(color.red, title="Bearish Break Color")
range_color = input.color(color.gray, title="Opening Range Color")

// Variables
var float or_high = na
var float or_low = na
var bool or_set = false
var bool bull_break = false
var bool bear_break = false

// Check if it's a new trading day
is_new_day = ta.change(dayofweek)

// Reset variables at start of new day
if is_new_day
    or_high := na
    or_low := na
    or_set := false
    bull_break := false
    bear_break := false

// Get session start time (9:30 AM EST)
session_start_hour = 9
session_start_minute = 30

// Check if we're in the opening range period
current_hour = hour(time, "America/New_York")
current_minute = minute(time, "America/New_York")
minutes_since_open = (current_hour - session_start_hour) * 60 + (current_minute - session_start_minute)

in_opening_range = current_hour >= session_start_hour and minutes_since_open >= 0 and minutes_since_open <= orb_minutes

// Build opening range
if in_opening_range and not or_set
    if na(or_high)
        or_high := high
        or_low := low
    else
        or_high := math.max(or_high, high)
        or_low := math.min(or_low, low)

// Mark opening range as complete
if not in_opening_range and not na(or_high) and not or_set
    or_set := true

// Calculate targets
or_range = or_set ? or_high - or_low : na
target_high = or_set ? or_high + or_range : na
target_low = or_set ? or_low - or_range : na

// Detect breakouts
bullish_break = or_set and close > or_high and not bull_break
bearish_break = or_set and close < or_low and not bear_break

// Set breakout flags
if bullish_break
    bull_break := true

if bearish_break
    bear_break := true

// Plot opening range lines
plot(or_set ? or_high : na, title="OR High", color=range_color, linewidth=2, style=plot.style_line)
plot(or_set ? or_low : na, title="OR Low", color=range_color, linewidth=2, style=plot.style_line)

// Plot target lines
plot(show_targets and or_set ? target_high : na, title="Target High", color=bull_color, linewidth=1, style=plot.style_linebr)
plot(show_targets and or_set ? target_low : na, title="Target Low", color=bear_color, linewidth=1, style=plot.style_linebr)

// Background color for opening range period
bgcolor(in_opening_range ? color.new(range_color, 90) : na, title="Opening Range Period")

// Breakout signals
plotshape(bullish_break, title="Bull Break", location=location.belowbar, style=shape.triangleup, size=size.normal, color=bull_color)
plotshape(bearish_break, title="Bear Break", location=location.abovebar, style=shape.triangledown, size=size.normal, color=bear_color)

// Labels for breakouts
if show_labels and bullish_break
    label.new(bar_index, high, "BULL BREAK", color=bull_color, textcolor=color.white, style=label.style_label_down, size=size.normal)

if show_labels and bearish_break
    label.new(bar_index, low, "BEAR BREAK", color=bear_color, textcolor=color.white, style=label.style_label_up, size=size.normal)

// Alerts
if alert_enabled and bullish_break
    alert("Bullish Opening Range Break", alert.freq_once_per_bar)

if alert_enabled and bearish_break
    alert("Bearish Opening Range Break", alert.freq_once_per_bar)

// Range fill
fill(plot(or_set ? or_high : na, display=display.none), plot(or_set ? or_low : na, display=display.none), color=color.new(range_color, 95), title="OR Range Fill")
How to Install
- Click Copy above to copy the full Pine Script source.
- Open TradingView and open any chart.
- Click Pine Editor at the bottom of the screen.
- Delete any existing code in the editor and paste the copied script.
- Click Add to chart (the play button). The indicator will appear immediately.
- Use the settings gear to adjust the opening range window (default 30 min), colors, and toggle labels / targets.
Usage Tips
⏱ Best Timeframes
Use on 1-min, 2-min, or 5-min charts for clean intraday ORB setups. Avoid applying to daily or weekly charts.
📐 Adjusting the Window
Try a 15-min ORB for faster markets or volatile names. Use 60-min for a broader range on slower days.
🎯 Using Targets
The 1× extension target is a common first take-profit. Many traders trail stops to OR High/Low after reaching it.
🔔 Alerts
Enable the built-in TradingView alert on this indicator to get push/email notifications the moment a breakout fires.
📊 Confirm with Volume
A breakout on expanding volume is far more reliable than one on thin volume. Pair with a volume indicator for confirmation.
🔁 Resets Daily
The opening range resets automatically each new trading day — no manual intervention needed.